Data Science Dispatch
Life Expectancy at Birth: A Descriptive Analysis Based on WHO 2024 Global Health Statistics
What country-level health indicators most shape how long people live — a multiple linear regression across 199 countries in the WHO's 2024 global health statistics.
By Ambro Quach, Brian Corgiat & Shane Brooks
Years of life expectancy, gained or lost per factor
Effect on life expectancy (years)
1. Introduction
Our study explores how country-level health indicators relate to life expectancy at birth (both sexes) across 199 countries using the 2024 data compiled by World Health Organization (WHO). We seek to examine and describe the relationships between life expectancy and ten health-related predictors, including smoking prevalence, air pollution (PM2.5), healthcare personnel density, homicide rate, HIV prevalence, safe drinking water access, road traffic mortality, universal health coverage, and GDP per capita. Using multiple linear regression models, we identify the variables most associated with longer life expectancy and evaluate their statistical and practical significance. This descriptive analysis aims to offer insights into global health patterns and may serve as a foundation for future policy-focused research.
Research Question: What is the relationship between country-level health indicators and life expectancy at birth with both sexes combined?
Understanding which health factors are most closely associated with life expectancy can assist international health agencies and policymakers prioritize and allocate resources effectively. For example, suppose access to clean water and the availability of doctors are found to correlate significantly with longer life expectancy. In that case, countries can be encouraged to invest in these areas.
Intended Audience: This analysis targets policymakers, global health organizations, and academic researchers interested in the links between national health systems and life expectancy. Our findings are descriptive, but they inform ongoing conversations about global health equity and investment prioritization, offering valuable insights for:
Policy advisers and health ministers focused on health interventions like pollution control and public health education. International (WHO, UNDP, and World Bank), along with non-governmental organizations (NGOs), are involved in health-related Sustainable Development Goals (SDGs) and advocate for equitable access to clean water and medical infrastructure. Academic researchers analyzing cross-country health and demographic outcomes.
2. Data
The WHO has been annually compiling ~50 health and health-related indicators for countries across the world since 2005 and hosts that data on their website for use. From this dataset, we initially selected 10 potential predictor variables and one outcome variable (life expectancy).
Data Wrangling: We consolidated data from two sources: WHO 2024 Health Statistics, which includes all outcome and health-related predictor variables. World Bank GDP & Population data, which includes GDP per capita and population estimates, cleaned and aligned using a country name mapping. WHO data was reshaped from long to wide using indicator codes and country names. Then, we harmonized sex-specific indicators and filtered to keep only those relevant to our outcome life_both and selected predictors.
Data Cleaning: We dropped missing or non-numeric entries (e.g., "not applicable", "not available"). Variables with extreme right-skewness (doctors, gdp, homicide, nurse_midwife, pm2_5, gdp_2023, pop_2023) were log-transformed to improve interpretability and linearity assumptions (See Appendix, Figure 6). Safe water access and Universal Health Coverage (UHC) index, though technically ordinal, were treated as metric variables due to their fine-grained scales and wide ranges (0–100). Final dataset includes only countries with complete data across all selected variables.
Conceptualization: To explore how national health factors are associated with life expectancy at birth, we define these concepts in our research:
- Life Expectancy at Birth is the average number of years a newborn is expected to live based on current mortality rates, serving as a measure of a country's health.
- Population Health Burden includes factors like behavioral risks (e.g., smoking), environmental issues (e.g., air pollution), and epidemiological exposures (e.g., HIV) that can impact well-being.
- Health Infrastructure and Access measure a country's capability to prevent and treat diseases, indicated by the availability of healthcare professionals and services, and basic health conditions like clean water.
- Economic Development is reflected in GDP per capita, representing a country's financial resources that influence health outcomes and infrastructure investment.
Operationalization: To analyze these concepts, we construct a dataset that merges the WHO 2024 Global Health Statistics with World Bank's GDP and population data. Our unit of analysis is the country, and each row represents one country (n ~= 199). All variables were cleaned, harmonized, and joined using standardized country names.
- Outcome Variable (Y): life_both: Life expectancy at birth of both sexes, in years. This is our only outcome variable that captures the main descriptive interest—how long people are expected to live across countries on average.
- Predictor Variables (X): We select ten predictors based on their relevance to public health burden, access, or infrastructure. These are operationalized as follows:
- Metric: tobacco: % of population aged 15+ who use tobacco, hiv: rate of new HIV infections, per 1,000 people, safe_water: % of population with access to safely managed drinking water, road_death: road traffic mortality rate, per 100,000, universal_health: Universal Health Coverage (UHC) Index, 0–100.
- Log-transformed: pm2_5: urban air pollution, annual mean PM2.5 concentration, doctors: density of medical doctors per 10,000 people, nurse_midwife: density of nurses and midwives per 10,000 people, homicide: homicide rate per 100,000 people, gdp_2023: gross domestic product per capita in USD, 2023, pop_2023: Total population, 2023.
3. Modeling
We start with the simplest credible model to establish a baseline association. From there, we progressively build more complex models to investigate and better understand the shape of the relationship between national health indicators and life expectancy at birth.
Prior to fitting the regression models, we identified several highly correlated variables using a correlation matrix. There are high correlation between road deaths and other variables, also between universal healthcare and doctors/nurses. Thus, we decided to drop those variables to maintain the integrity of Classical Linear Model (CLM) assumptions in Models B, C, D.
Model D: Simplest Credible Model (GDP only) — This model serves as a benchmark to evaluate the overall association between economic development and life expectancy using a single predictor, which is GDP per capita. It allows us to assess whether there is any meaningful relationship between a country's wealth and its average life expectancy without conditioning on other variables. The model shows a positive relationship but with limited explanatory power due to low R2, indicating that while GDP matters, it alone is insufficient to describe variations in life expectancy across countries.
Model C: Universal Healthcare, Tobacco, Log(GDP, HIV, Homicide, PM2.5) — This model incorporates additional environmental and behavioral risks, and structural healthcare quality. The log transformation allows for better capturing of diminishing returns and skewed global distributions. Compared to Model D, this model improves explanatory power (higher adjusted R2, lower AIC, BIC), showing that health and environmental conditions are essential components of life expectancy beyond economic status alone.
Model B: Universal Healthcare, Tobacco, Log(GDP, HIV, Homicide, Safe Water, PM2.5) — Compared to model C, this model has one additional variable: safe drinking water that refines the narrative by addressing disparities in clean water access. This variable can be important in lower-income or rural areas. Although this variable marginally improves model performance, it allows depths in interpretation that countries with better access to safe drinking water tend to report longer life expectancies, even after accounting for GDP and other factors.
Model A: Full Model with Log Transformed Predictors — This model has all available predictors that includes log-transformed personnel densities and population size. Although this model achieves the highest adjusted R2, it has multicollinearity concerns (shown in the correlation matrix). Strong correlations between medical personnel and UHC index suggest that the latter can sufficiently capture healthcare process. This model is less interpretable and redundant, but it can serve as a useful upper bound for comparison.
| Model | R² | Adj R² | AIC | BIC |
|---|---|---|---|---|
| A | 0.87 | 0.84 | 360.13 | 389.91 |
| B | 0.85 | 0.83 | 361.20 | 381.82 |
| C | 0.83 | 0.82 | 554.91 | 576.58 |
| D | 0.50 | 0.49 | 1,074.72 | 1,084.21 |
Model summaries for life expectancy (both sexes). Model C is our preferred specification for inference.
4. Evaluating Regression Assumptions
Multicollinearity Check
| Model | Tobacco | HIV | UHC | Homicide | GDP | Water | PM2.5 | Doctors | Road Deaths | Population |
|---|---|---|---|---|---|---|---|---|---|---|
| A | 2.16 | 1.96 | 11.38 | 2.12 | 9.00 | 6.68 | 2.09 | 11.14 | 3.08 | 1.28 |
| B | 1.37 | 1.64 | 7.67 | 1.80 | 6.57 | 6.43 | 1.95 | — | — | — |
| C | 1.37 | 1.59 | 4.28 | 1.84 | 4.99 | — | 1.71 | — | — | — |
Figure 1: Variance Inflation Factors.
We calculated Variance Inflation Factors (VIFs) for Models A, B, and C to evaluate the degree of multicollinearity among predictor variables. The table above summarizes VIF values for the life expectancy of both sexes model. We excluded Model D from this analysis because it only has a single predictor (GDP), which is not applicable for VIF calculation.
Model A and B show elevated VIFs for variables such as universal health, GDP, water, and doctors, with some values exceeding 10, indicate strong correlations between these predictors. These findings align with our earlier correlation matrix, which showed high associations between healthcare infrastructure variables. Model C excludes redundant predictors such as doctors and water. It exhibits lower and more stable VIF values below 5 (common thresholds for concern), suggesting a moderate multicollinearity. Based on the result, we chose this model as our preferred specification for inference, as it satisfied the (1) no multicollinearity / perfect collinearity assumption.
Residual Diagnostics
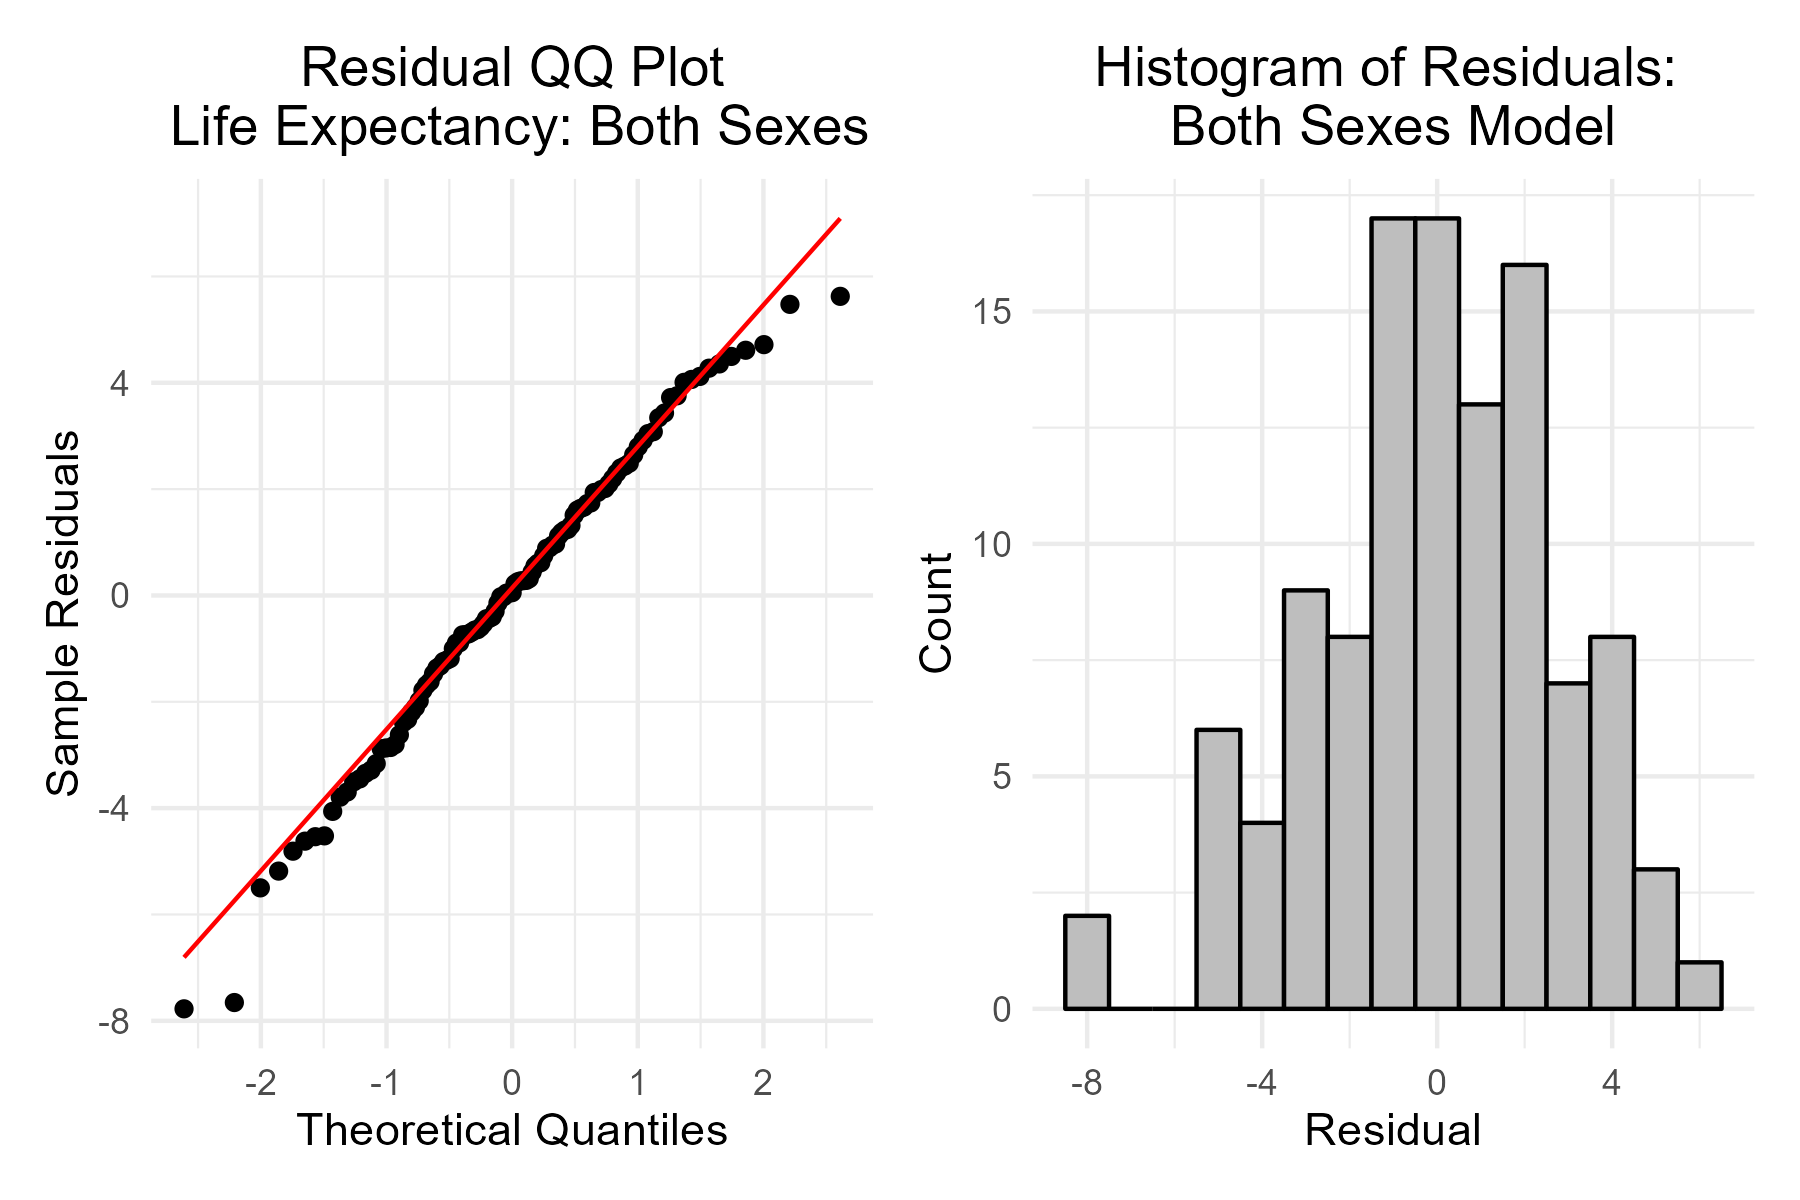
Figure 2: QQ Plot and Histogram of Residuals.
QQ Plots for Model C show that residuals align reasonably well with the normal distribution, with only slight deviations at the tails. These minor deviations indicate some mild non-normality. But, the central portions of the distribution are close to the 45-degree line, suggesting a generally good fit. Also, the histogram of residuals appears approximately symmetric and centered around 0, further supporting the assumption of normal errors. There is no extreme skewness, and the spread of residuals also suggests homoskedasticity. These diagnostics taken together illustrate that the model satisfied the assumptions of (2) independent, identically distributed (I.I.D.) and approximately (3) normal residuals.
Residuals vs. Fitted & Breusch-Pagan Test
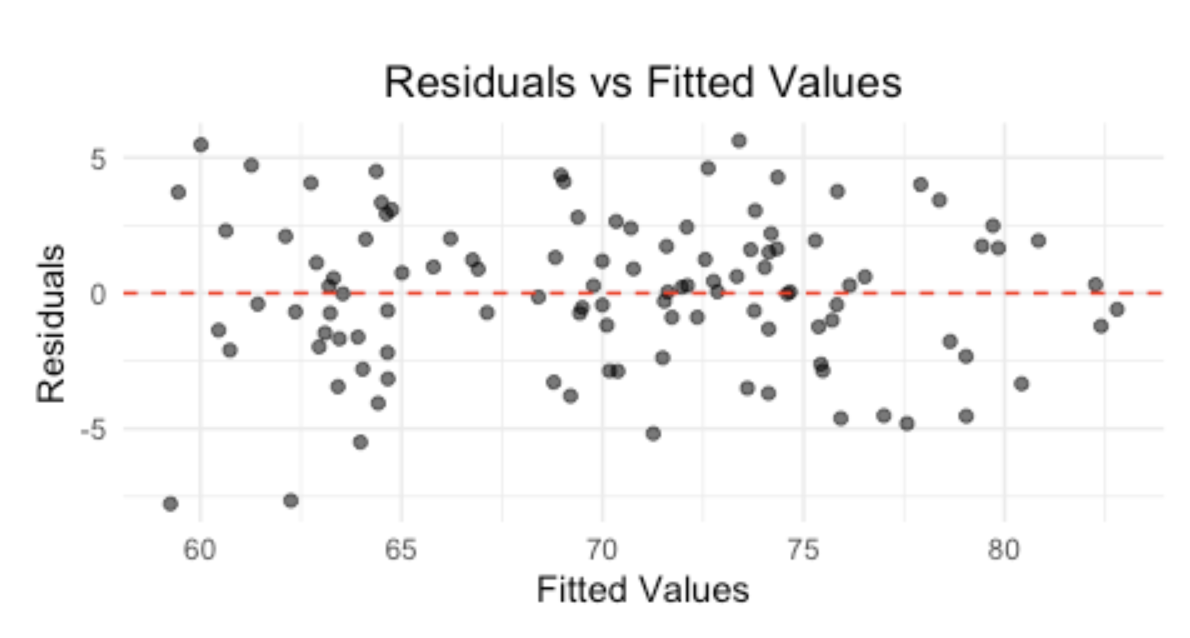
Figure 3: Residuals vs. Fitted Values.
The residual pattern looks to be symmetrically distributed around 0 across the range of fitted values. Although visually, the violation of constant variance (4) homoskedasticity is not strongly evident, the Breusch-Pagan test for life expectancy of both sexes has a p-value < 0.01 and a t-statistic of 21.8, suggesting the presence of heteroskedasticity. Thus, we recommend using robust standard errors (HC1) to account for heteroskedasticity when interpreting coefficients to ensure valid inference.
Predictors vs. Life Expectancy Outcome
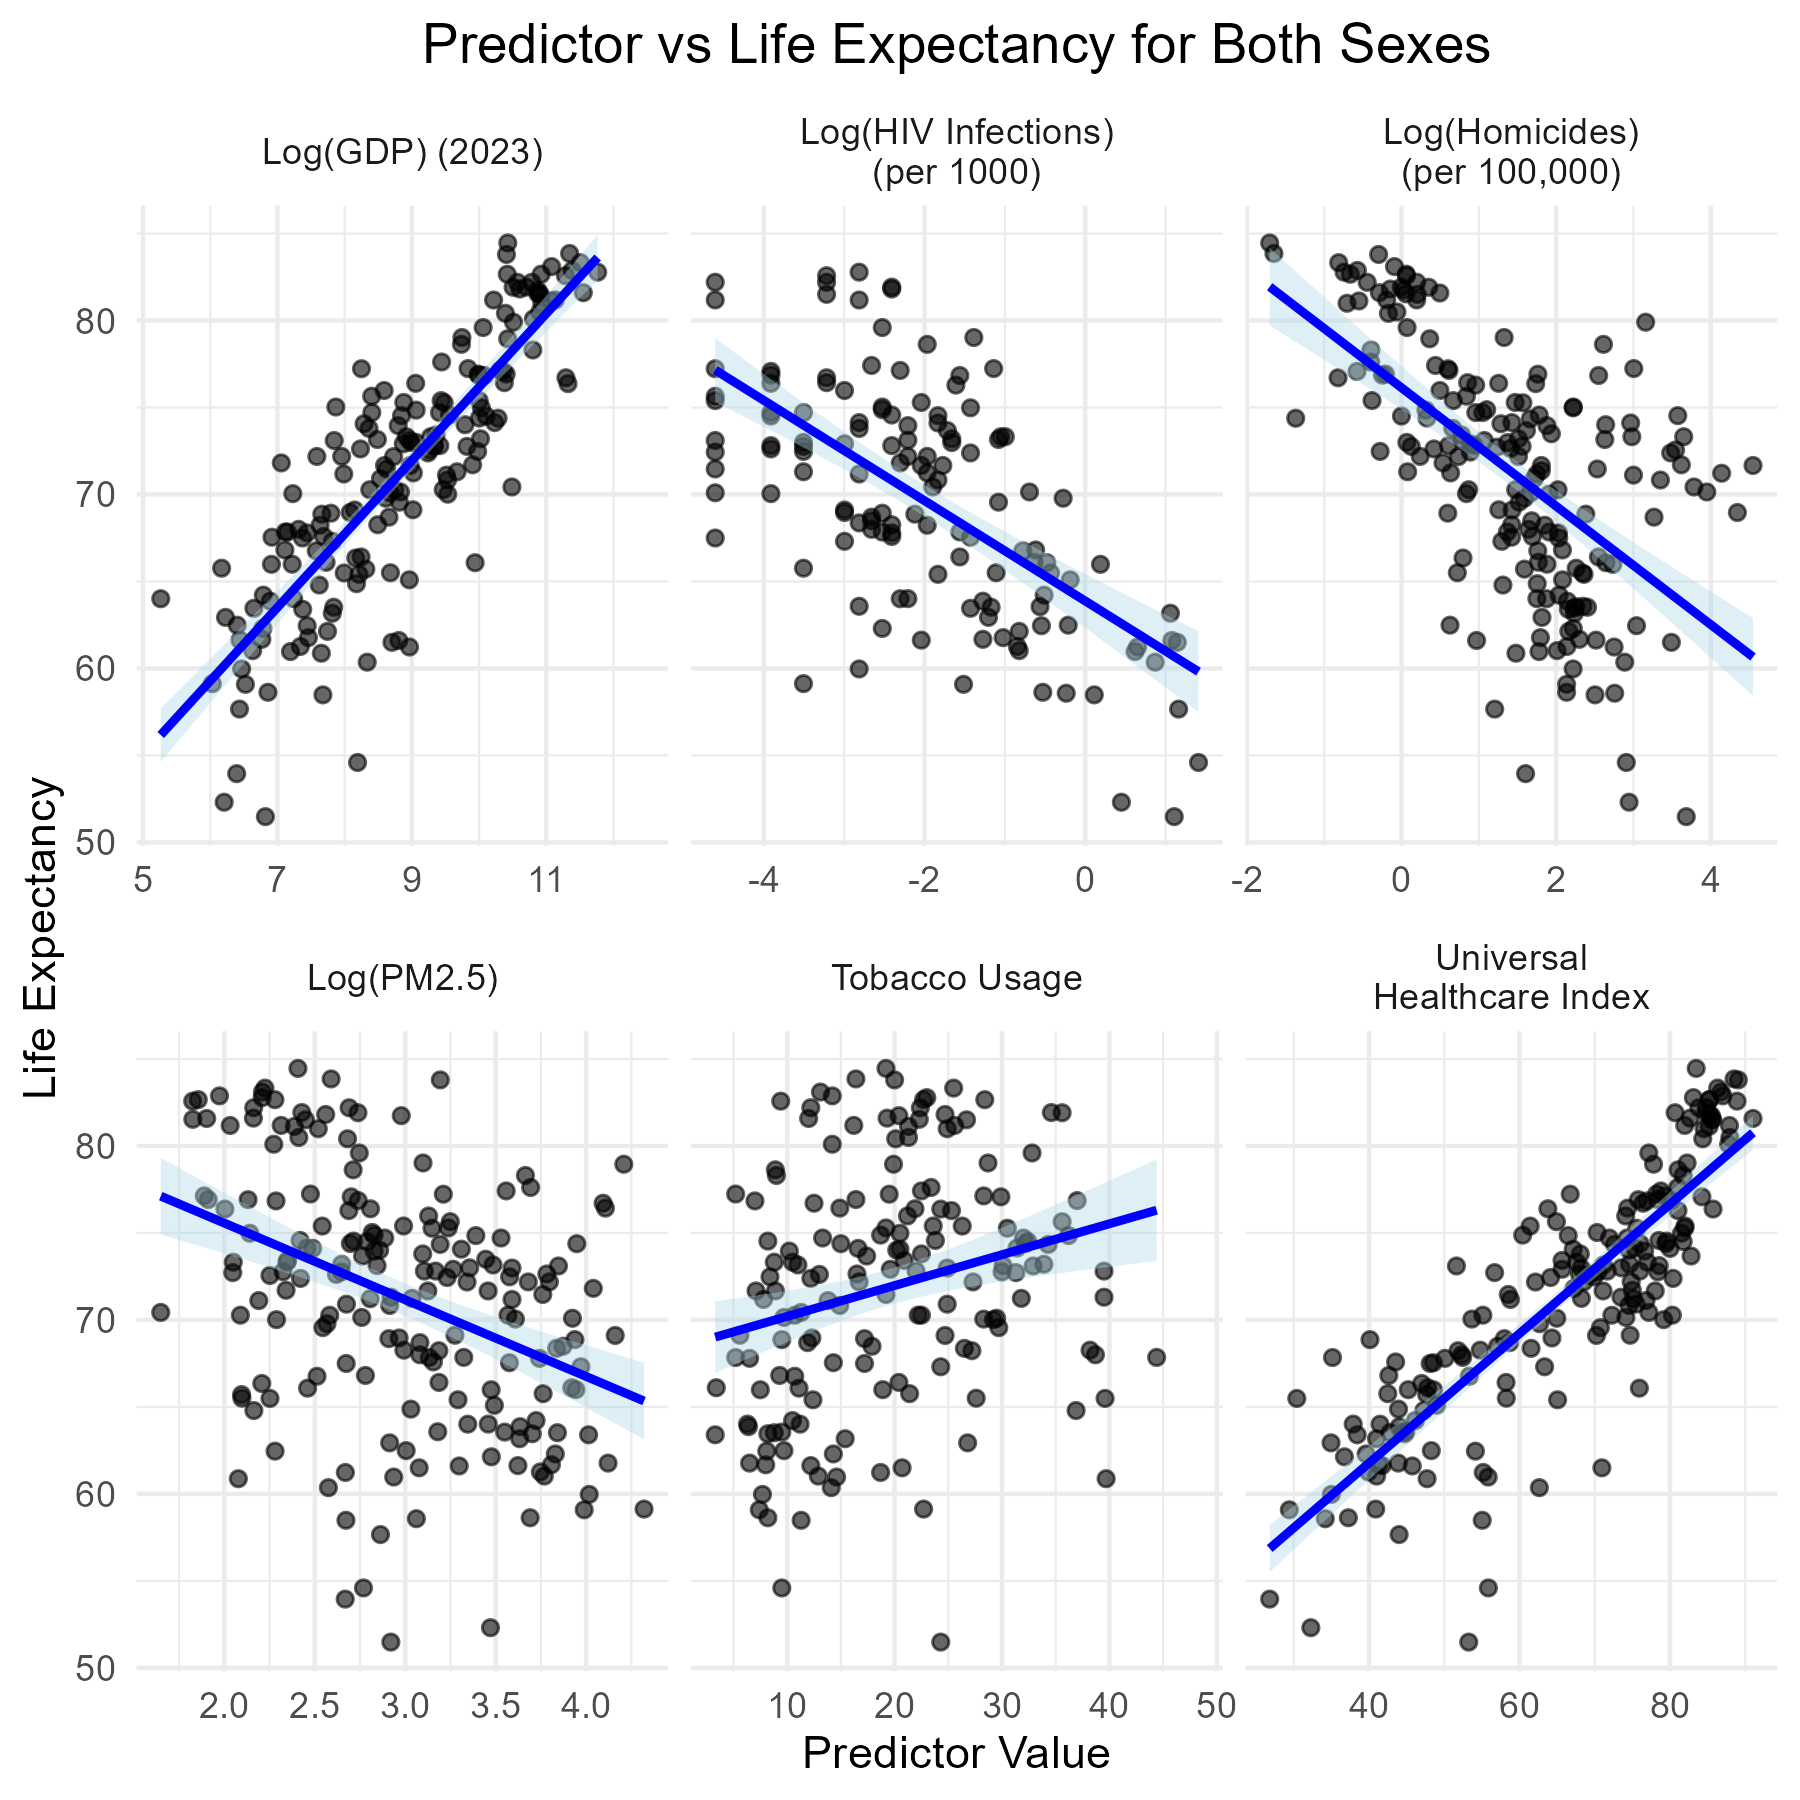
Figure 4: Scatterplots of Health Predictors vs. Life Expectancy.
We use scatterplots with fitted linear trend lines to display the direction and shape of the relationship between our selected predictors (health indicators) and outcome variable (life expectancy of both sexes). Based on the visual evidence, most of our predictors exhibit approximate linearity, especially those with strong theoretical justification. Therefore, the (5) linear conditional expectation assumption is reasonably satisfied.
- Log(GDP) shows a strong positive linear relationship with life expectancy: countries with higher GDP per capita tend to have longer average lifespans.
- Universal Healthcare Index also shows a positive trend, reinforcing the notion that better health service access correlates with population longevity.
- Log(Homicide Rate) and Log(PM2.5) show negative linear trends, supporting the idea that higher rates of violence and urban air pollution are associated with shorter life expectancy.
- Log(HIV Infection Rate) has a slight negative trend, with a flatter slope and more spread compared to other predictors. Tobacco Use appears to have a relatively weak and noisy trend in the plot, suggesting an inconsistent relationship.
5. Interpreting Results
| Variable | Estimate | Robust Std. Error | t-Stat | P-Value |
|---|---|---|---|---|
| Intercept | 50.21 | 4.07 | 12.35 | 0.000 |
| Log(GDP) | 1.16 | 0.44 | 2.61 | 0.010 |
| Log(HIV) | -1.67 | 0.24 | -7.01 | 0.000 |
| Universal Health | 0.17 | 0.04 | 4.85 | 0.000 |
| Log(Homicide) | -0.81 | 0.31 | -2.58 | 0.011 |
| Tobacco Use | -0.05 | 0.03 | -1.56 | 0.121 |
| Log(PM2.5) | -0.71 | 0.59 | -1.21 | 0.231 |
Figure 5: Regression Model Coefficients (Model C, both sexes).
Statistical Significance
Based on the robust standard errors, we found the following predictors—Universal Health Index, Log(GDP), Log(HIV), and Log(Homicide) to be statistically significant at the 0.05 level. Tobacco Use and Log(PM2.5) do not meet the conventional thresholds of p < 0.05 for statistical significance, indicating weaker or uncertain associations in this model.
Practical Significance
As for practical significance, we examine the magnitude and interpretability of our coefficients:
- Log(GDP): A ten times increase in GDP from $1,000 to $10,000 resulted in an approximately increase of ~1.16 years in life expectancy, showing the important role of economic development in shaping health infrastructure and outcomes.
- Log(HIV Infection Rate): A ten times increase in HIV incidence correlates with a 1.67-year decrease in life expectancy, highlighting the substantial impact of infectious disease on national health outcomes.
- Universal Health Coverage Index: A 10-point increase on the 0–100 scale resulted in an additional 1.7 years of life expectancy, emphasizing the importance of access to essential health services.
- Log(Homicide Rate): A ten times increase in the homicide rate is associated with a 0.81-year decrease in life expectancy, reflecting the burden of violence and insecurity on health.
- Tobacco Use: Although the relationship is negative (-0.05 years per 1% increase in usage), the estimate is not statistically significant, and its practical impact appears to be modest.
- Log(PM2.5): The effect of pollution is negative as expected, but the estimate is statistically uncertain and less robust due to confounding factors in this model.
6. Appendix
Example Case
While GDP per capita is positively related to life expectancy, our findings show that health system access and disease burden factors—particularly Universal Health Coverage and HIV incidence—have even larger practical impacts, emphasizing the importance of investing in health infrastructure. These results suggest that policy efforts focused on expanding healthcare access, reducing violence, and controlling infectious diseases may increase population longevity, especially in lower-income settings.
To illustrate the impact of these predictors, consider two hypothetical countries:
- Country A has a GDP of $1,000, UHC index of 50, and high HIV prevalence.
- Country B has a GDP of $10,000, UHC index of 80, and low HIV prevalence.
Holding other factors constant, Country B would be predicted to have:
- ~1.16 additional years of life expectancy due to higher GDP
- ~5.1 more years due to better UHC access (0.17 × 30 points)
- ~1.67 years of life expectancy gained from lower HIV rates
This results in an estimated 8-year increase in life expectancy, showing the real-world significance of these health indicators.
Additional Visualizations
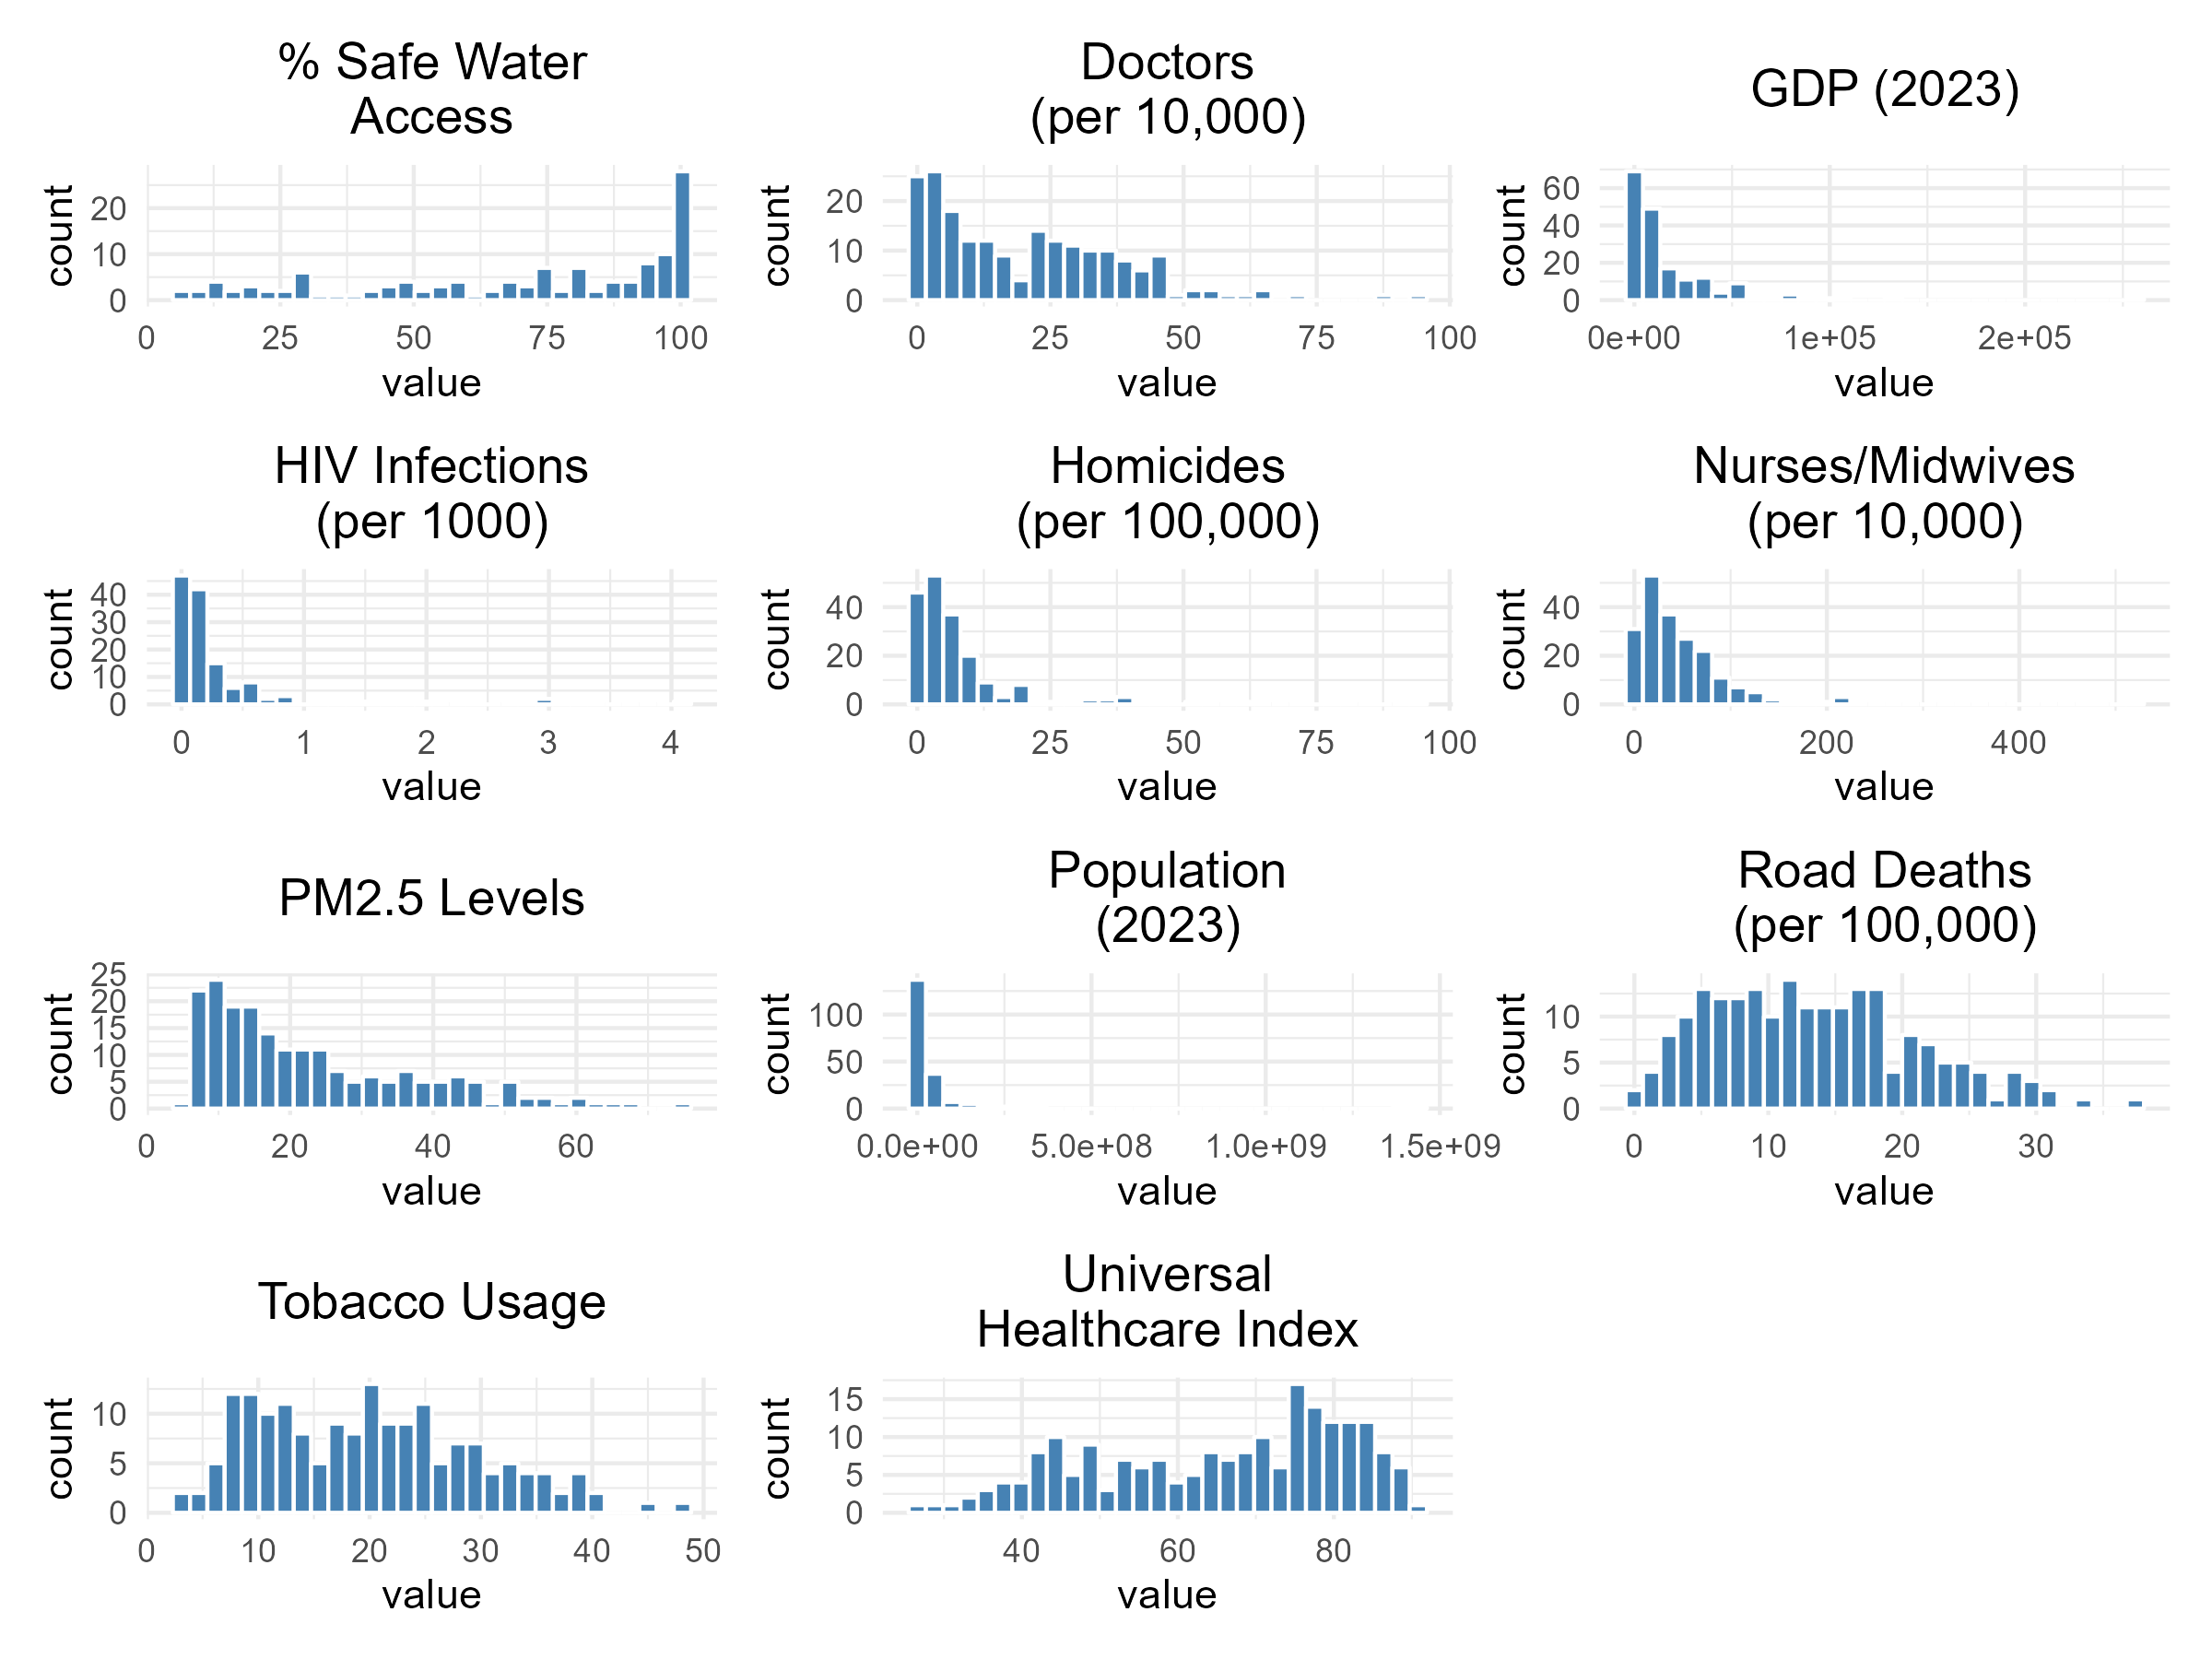
Figure 6: Histograms created to show the distributions of predictor variables. Variables with strong right skews, such as GDP, HIV, PM2.5, homicides, doctors, and nurses/midwives were log-transformed for subsequennt model assessment.
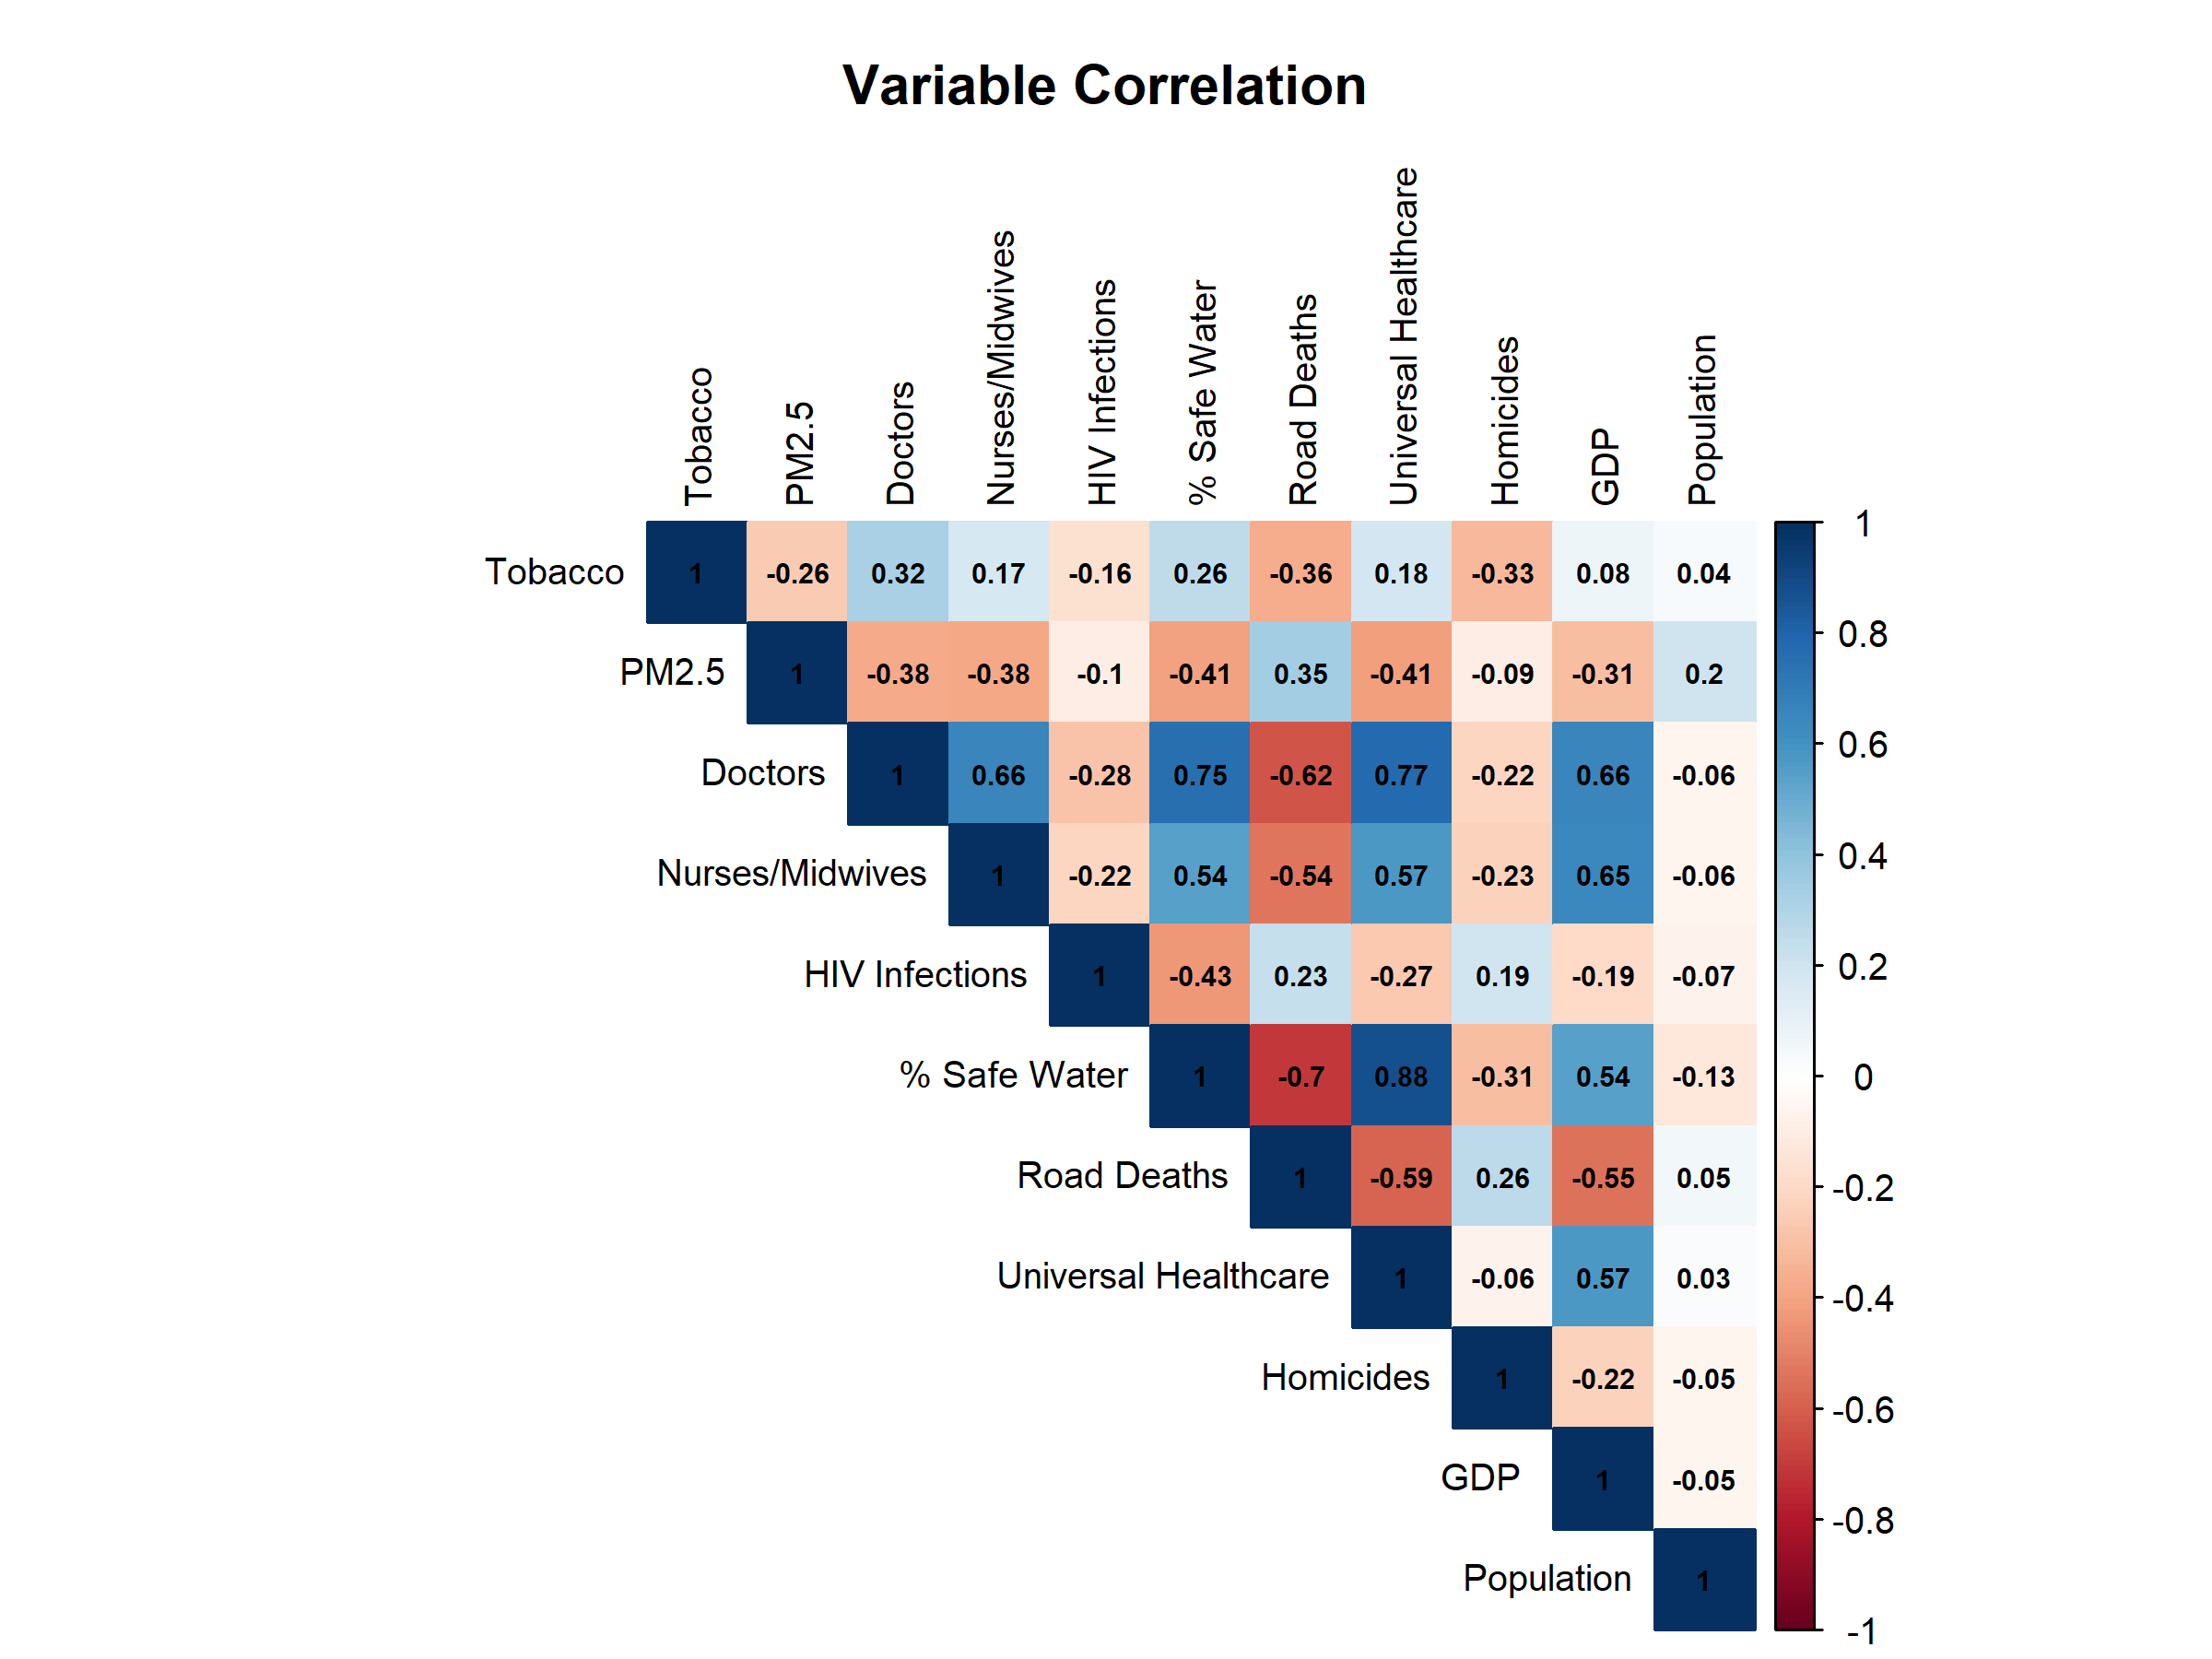
Figure 7: Correlation Matrix (left) and Model Summaries (right).
Other Insights
We also estimated a model using the difference in life expectancy between males and females life_diff. The direction and significance of most predictors were consistent with the life_both model. No dramatic differences were observed in the overall effect of key relationships. This consistency suggests that our selected health indicators influencing life expectancy apply similarly across sexes, with only slight variations in coefficient magnitudes.
References
World Health Organization. (2024). World health statistics 2024: Monitoring health for the SDGs, sustainable development goals. https://www.who.int/publications/i/item/9789240094703
World Bank. (2025). 2023 Population, total [Data set]. World Development Indicators. https://data.worldbank.org/indicator/SP.POP.TOTL
World Bank. (2025). 2023 GDP per capita (current US$) [Data set]. World Development Indicators. https://data.worldbank.org/indicator/NY.GDP.PCAP.CD
A statistics project from UC Berkeley's School of Information, by Ambro Quach, Brian Corgiat, and Shane Brooks.