Data Science Dispatch
Does Congress Have an Age Problem?
This project aims to understand how Congress members' age has been changing, if at all, and how well Congress members' age represents the age breakdown of the United States population.
By Gabriella Tom, Ambro Quach, Chad Adelman & Uma Krishnan
Congress vs. population average age over time
1. Overview
U.S. Congress is the legislative branch of the United States federal government. Congress is responsible for drafting laws, approving the budget, declaring war, and overseeing the executive branch, playing a key role in balancing the power of the government. Congress comprises 2 chambers: the Senate and the House of Representatives. The Senate is the upper body of Congress, which contains 100 members, each elected for 6 years. The House of Representatives, the lower body, contains 435 members, each elected for 2 years. There are no term limits for members of Congress.
Congress is supposed to represent the citizens of the United States, but it has historically been, and remains today, disproportionately representative of them. Since its establishment in 1789, members of Congress have disproportionately represented people who have benefited from social hierarchies: white men.
Over the past few decades, congress has progressed toward a more representative sample of race and gender in the US. While this progress on race and gender diversity falls far short of providing a Congress genuinely representative of the United States population, there is evidence of movement in the correct direction. However, one attribute of Congress that has not seemed to be diversifying to better represent the United States population over the past decades is Congress members' ages.
Since age is a numerical variable, unlike race and gender, truly understanding the makeup of Congress members' age requires a deeper analysis. This project aims to understand how Congress members' age has been changing, if at all, and how well Congress members' age represents the age breakdown of the United States population.
2. Research Questions
Primary Question: How has Congress's age changed since the turn of the millennium, and how does this track with the shifting age demographic in the United States?
Sub Question: During this time, how has the average age at which Congress members are elected vary based on political party, chamber, and gender?
3. Data Background
We intend to analyze datasets containing information about US Congress members and the US general population since 2000. We plan to focus the analysis on the age of the members of Congress, and how it has changed over time compared to the US population. The dataset allows us to explore the data to determine congress member's ages across the following attributes:
- Political party (Democrats vs Republicans)
- Gender (Male vs Female)
- Chamber (Senate vs House of Representatives)
We will measure average age using various methods to analyze average for numerical variables such as median, mean, and mode. We will also be looking at min and max to understand the age range, and ensure logical data.
4. Datasets
4.1 Congress Data
Description: We will use data created and published by the @unitedstates project, a database for data related to the United States government. We will be using the legislators-historical.json file. This dataset contains information on members of the United States Congress from its founding in 1789 until the 118th Congress, whose term started in January 2023.
Size: This data set has 52,319 rows and 16 columns.
Rows: Each row in this dataset represents one term of a congress member. Congress members who served partial terms are represented by one term as well.
Source:
- The Data source can be found here: theunitedstates.io
- The GitHub Repo, which contains the dataset, can be found here: github.com/unitedstates/congress-legislators
4.2 Census Data
Description: StatsAmerica, a service of Indiana Business Research, publishes the data being used. StatsAmerica provides data on regional demographics in America, amongst other things. We will use the "Population by Age and Sex" file, which has census data on relevant characteristics, primarily age and gender, for this analysis. The most recent data is as of 2019.
Size: This data set has 63,882 rows and 17 columns.
Rows: Each row in this dataset represents the demographic breakdown of a group of US citizens.
Source: The data can be found below. Population by age and sex was the data file pulled — statsamerica.org/downloads
5. Hypothesis
- Congressional Age Over Time: The average age of Congress members has steadily increased from 2000 to 2024 and is consistently higher than the average age of the US population.
- Age Disparity Between Congress and Population: The age gap between Congress members and the US population has widened over time, with Congress becoming less representative of the average US citizen's age.
- Age Differences by Party: Members of Congress from different political parties differ noticeably in average age, specifically looking at average age when first elected, with Republicans skewing older than Democrats and Independents when first elected.
- Age Differences By Gender: Male members of congress are first elected at a higher average age than female members of congress.
- Age differences by Chamber: Members of the senate are first elected at a higher average age than the house of representatives since it is the more prestigious chamber.
6. Data Setup, Cleaning, and Sanity Checks
6.1 Congress Data
The legislators-historical and legislators-current datasets were in JSON format. So, we first converted them into a data frame using pandas before we started analyzing them. The terms of each Congress member were nested in an array of objects. Thus, we need to flatten that array into rows of terms, and each row represents a congress member with a specific term. By doing this, we can now analyze the average age of Congress members for every new cohort of Congress. However, to calculate the aggregated age and gender data, we group the Congress members by the unique bioguide_id to count each member only once, mitigating the duplicate rows resulting from our previous action of flattening the array. In addition, we changed the column name 'type' to 'chamber' and its value from 'rep, sen' to 'House, Senate' for better readability. We translated columns that present date-time as strings into pandas date-time formats. For modularity purposes, we created grouping functions to explore different datasets, such as (incumbent and non_incumbent or combined), preventing redundant codes in our analyses.
6.2 Census Data
The "Population by Age and Sex - US, States, and Counties" dataset is in CSV format. The columns are set up by description (Total in the US, Total in State, Total in County) by year, according to their age group. Using Pandas, we converted the CSV to a data frame. Since we only wanted to use the US total population, we filtered it to only where description = 'U.S.' We validated that there were no duplicates in the necessary columns we wanted to use: Description, Year, Total Population, and Population 0-4. Population 5-17, Population 18-24, Population 25-44, Population 45-64, & Population 65+, Male Population, & Female Population. We removed unnecessary columns: IBRC_Geo_ID, Statefips, and Countyfips.
7. Data Analysis
We will be using the following packages for this data analysis: numpy, pandas, matplotlib, and datetime.
7.1 Congress Data
This dataset examines the age of members of Congress from 2000 to 2024 by term, as well as the age that each congress member is first elected. The dataset provides the ability to segment by political party, chamber, and gender.
- Age Metrics: For average age, we look at key statistics including the mean, median, mode, maximum, and minimum ages of Congress members. These metrics are broken down further by:
- Party affiliation (e.g., Democrats, Republicans, Independents)
- Gender (male vs. female)
- Chamber of Congress (Senate vs. House of Representatives)
- Age Over Time: The analysis tracks changes in the average age of Congress members for each new election cohort, which occurs every two years. The average age is calculated based on the difference between the members' birth year and the start of their term.
- Party Affiliation: The analysis considers the age of members of Congress categorized as Democrats, Republicans, and Independents.
- Gender Metrics: The analysis considers the age of members of Congress categorized as Male and Female.
- Chamber: The analysis considers the age of members of the House of Representatives vs members of the senate.
7.2 Census Data
To provide a comparative context, the analysis also examines the age and gender statistics of the US population during the same timeframe. The following metrics are included:
- Age Metrics: Key age statistics, including the mean, median, mode, maximum, and minimum ages, are calculated for the US population from 2000 to 2019.
- Age Over Time: The average age of the US population is tracked over time, segmented into comparable cohorts every two years. This is similar to the congressional analysis.
8. Data Visualizations
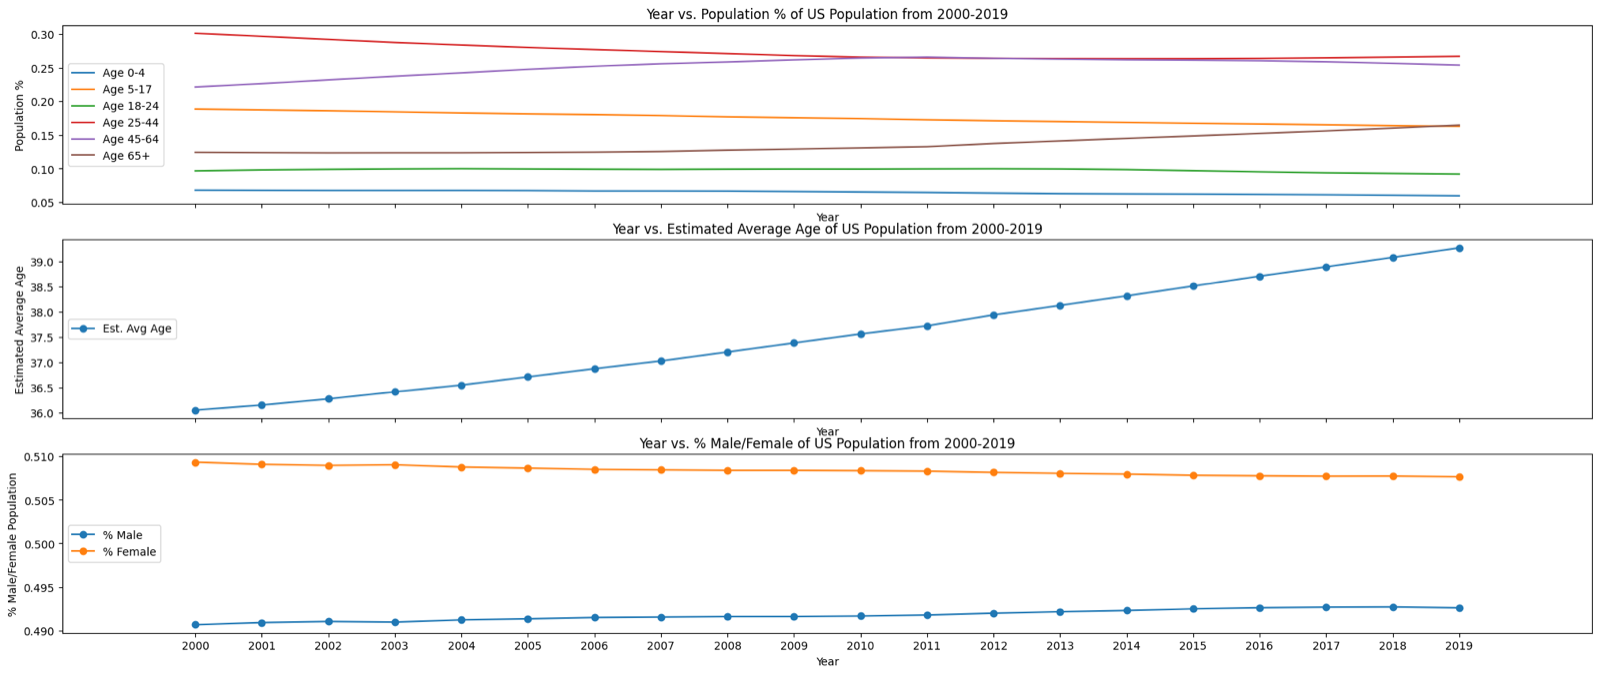
8.1 Changing US Demographics
Using the census data, the chart below shows how demographics have changed over the past 2 decades. The top chart shows that the age groups of 45-64 and 65+ have increased as a proportion of the population. Alternatively, age groups 5-17 and 25-44 have decreased. The middle chart shows how this has impacted the "average age," average in this case being mean. The average age has been increasing at roughly 1 year per decade over the past 2 decades, up to 39 in 2019. The bottom graph shows how gender breakdowns have been changing. While there has been a slight trend towards an even split of men and women, women have consistently made up within 1% above half the population.
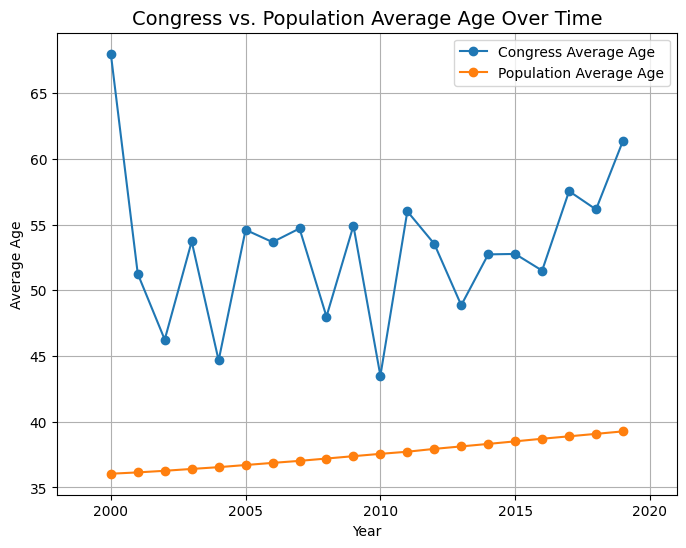
8.2 Congress vs. Population Average Age Over Time
The chart below shows how congress age has changed over time relative to the US average age. While the US population's average age increases smoothly by about 1 year every decade, Congress's average age has much more variance over the previous decades. From 2000 to 2020, while there is no conclusive trend of average age in either direction, this figure ranges from lower 40s to 60s, anywhere from 5 to 30 years older than the average US citizen.
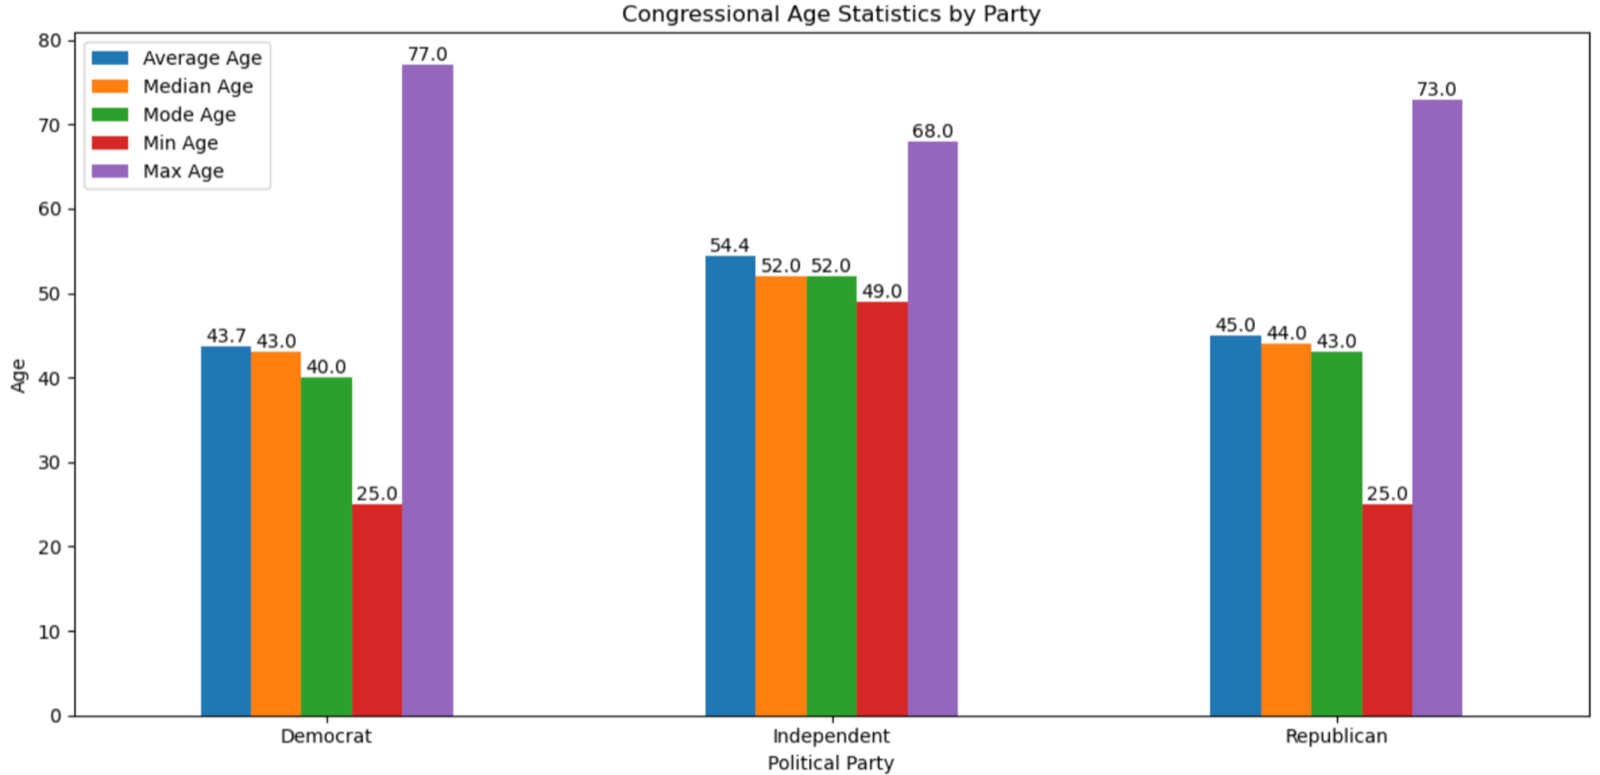
8.3 Congress Age by Party
We were interested in seeing if the average age when a congressperson is first elected is split differently across notable categories of congress members. Initially, we looked at the split by political party. Between the two major political parties that encompass 98% of congress members - the Democrat party and the Republican party - the average age at which a congress member is first elected is similar in the Mid-40s, while the full age range is from 25 years old to about mid 70s. Congress members not affiliated with either of these parties tend to be older when first elected, but these members only make up roughly 2% of Congress. Unsurprisingly given the smaller sample, the age range for independent congress members is much smaller than that of either two major political parties. This data is over the time-frame reviewed of 2000 to 2024.
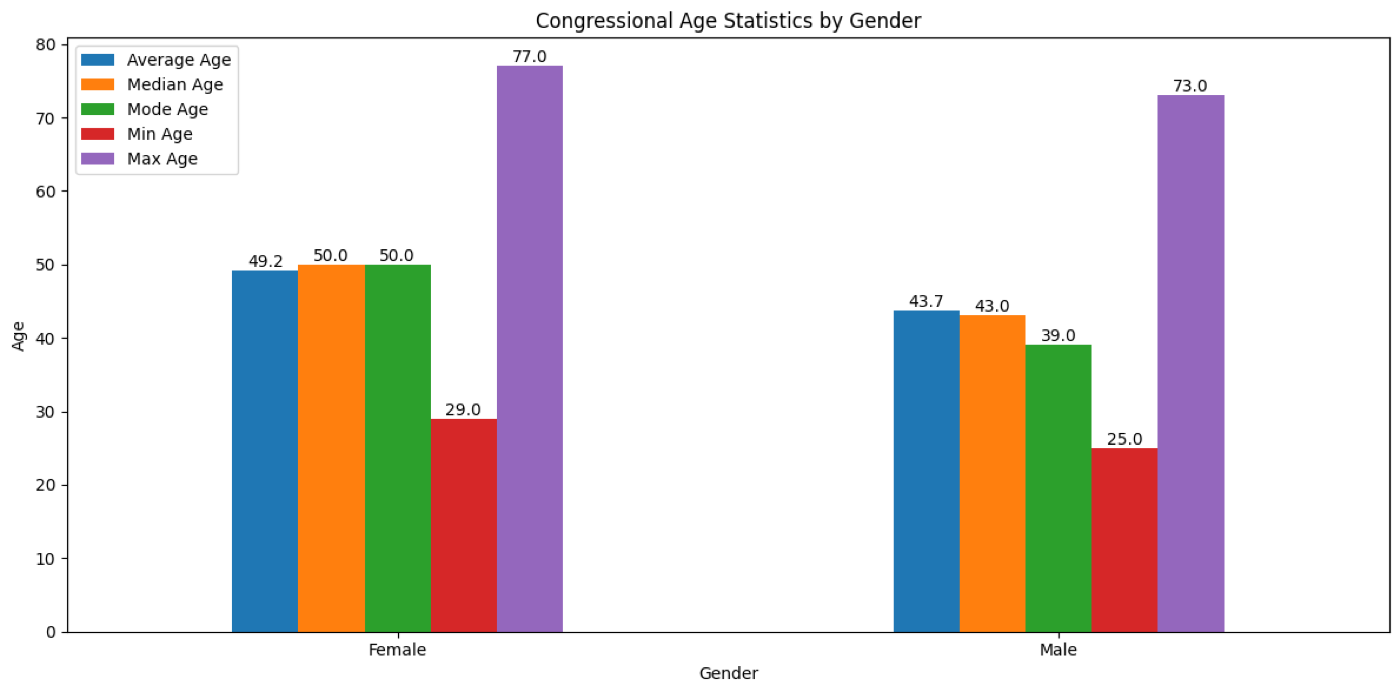
8.4 Congress Age by Gender
We were also interested in whether the average age of congress members first elected is different across genders over the time-frame studied. There does seem to be a noticeable difference of average age first elected between the two genders. Females are 50 years old on average while first elected over the time frame studied, while males tend to be about 7 years younger at 43.
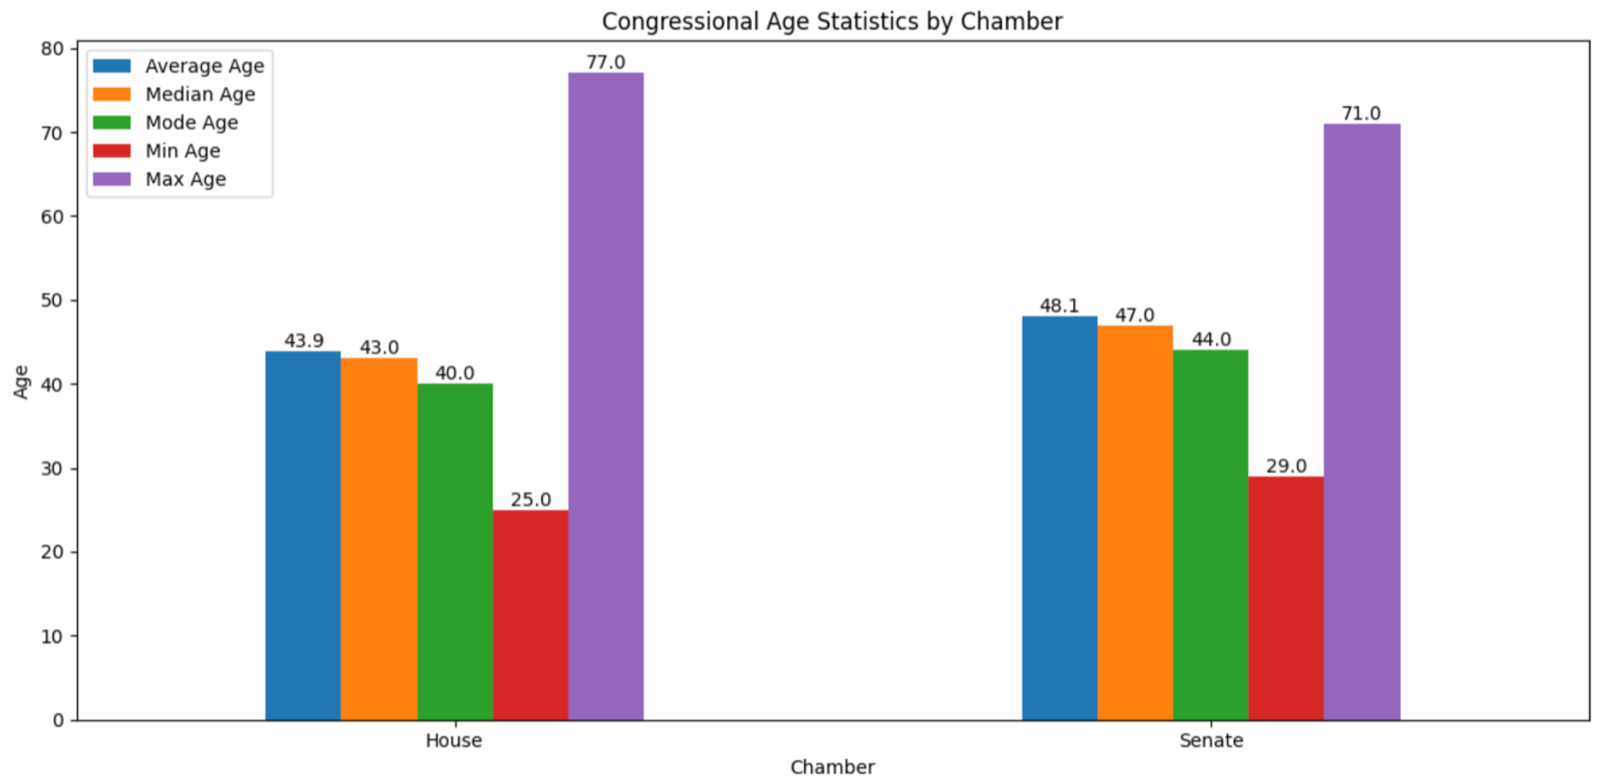
8.5 Congress Age by Chamber
Lastly, we looked at the average age at which congress members were first elected by chamber. The senate has an older average age for when congress members are first elected compared to the house of representatives, with Senate members being about 5 years older.
9. Results
- Congressional Age Over Time: The average age of Congress members has varied over decades from 2000 to 2024; however, there is no evidence that the average age of Congress has shifted in either direction over that time period. As expected, the average congress member's age is consistently higher than the average age of the US population as a whole.
- Age Disparity Between Congress and Population: There is no evidence that the age gap between Congress members and the US population has widened from 2000 to the present.
- Age Differences by Party: There is no evidence that members of Congress from different political parties differ noticeably in average age. The average age is largely consistent across the two major parties in the time frame reviewed.
- Age Differences By Gender: Contrary to our initial hypothesis, females in congress get initially elected at an older age than males.
- Age differences by Chamber: Congress members in the senate get elected at an older average age than congress members in the house of representatives. This aligns with our hypothesis since the senate is the more prestigious chamber.
10. Ethics and Privacy
Congress Data — We do not believe there are any ethical concerns in analyzing public data to examine the age of congress members over the past twenty years since the data being used is publicly available. Members of Congress are public officials, and information about their age, chamber, and gender is accepted for public consumption. As such, analyzing these aspects of their careers and lives falls within the bounds of accepted practices for political analysis.
Census Data — Using publicly available census data to analyze changes in age demographics across regions and genders over the past 20 years is ethically acceptable because the data does not contain information for individual entities, so there are no privacy concerns. Census data is collected and shared to inform public understanding, making it a key resource for demographic analysis.
11. Conclusion and Discussion
While Congress has made progress regarding racial and gender diversity, its age composition has remained largely unchanged over the past two decades. The average age of Congress members continues to be higher than that of the general US population. This is true for both genders, both chambers, and both political parties. This lack of age diversity suggests that Congress may not fully reflect the concerns of younger Americans, highlighting the need for greater generational representation in the legislative process. As the nation evolves, ensuring a more age-diverse Congress could help address the population's diverse challenges today.
12. Sources
- The Changing Face of Congress — Pew Research
- Census QuickFacts
- 117th Congress Book List — Library of Congress
- Both Republicans and Democrats Have an Age Problem — FiveThirtyEight
- theunitedstates.io
- github.com/unitedstates/congress-legislators
- statsamerica.org/downloads
A data science project from UC Berkeley's School of Information, by Gabriella Tom, Ambro Quach, Chad Adelman, and Uma Krishnan.